What does it mean to “do science”?

This is a guest post by PhD student Shaun Turney. I fully endorse it. It’s awesome.

As a scientist, when I’m brushing my teeth, I’m doing science.

This thought occurred to me yesterday as I was trying to reason myself out of a bout of imposter syndrome.

I was thinking: I don’t work hard enough to be a good scientist. I haven’t even done any science all day. I helped a francophone colleague with grammar, I read some stories on Eureka Alert, and I wrote up a field work budget. And that’s just some of the more useful sounding stuff: I also spent a fair amount of time playing basketball with a boy I mentor, cooking dinner, staring into space, telling my partner about my imposter syndrome issue, and reading a science fiction book. I looked through zero microscopes, wrote zero papers, and made zero hypotheses.

I convinced my brain to stop bullying me by distracting it with a question: What does it mean to “do science”?

Shaun Turney, vacuuming the Tundra. It's part of doing science.

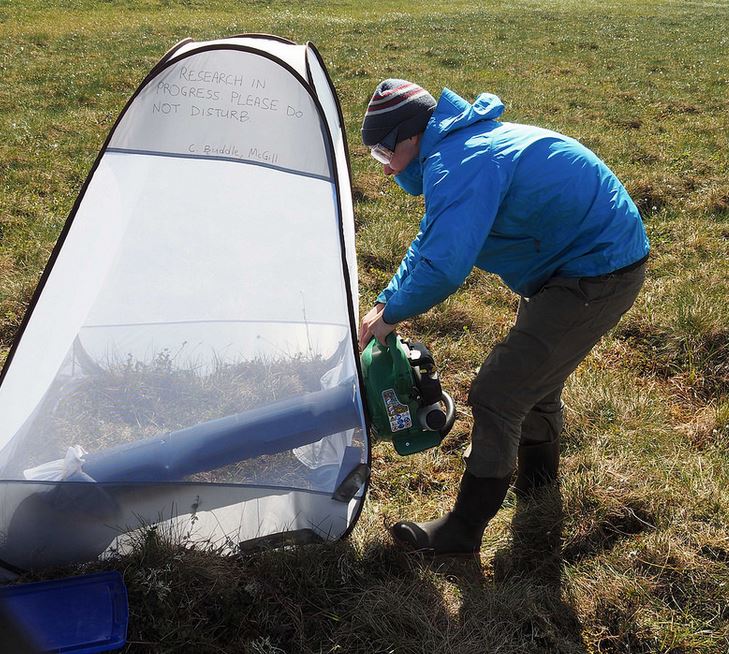
Shaun Turney, vacuuming the Tundra. It’s part of doing science.

It would help to know first what exactly “science” is, but philosophers are nowhere near resolving that debate. Science is often defined as a set of processes or tools, the most notable of which being the scientific method. Science is also the body of knowledge produced by that set of processes. These definitions seem pretty solid until you prod them a little: which tools and processes count as scientific? Which knowledge counts as being part of Science? What is “knowledge”, for that matter!

So “Doing science” could be roughly and problematically defined as carrying out scientific processes, like the scientific method, to add to science’s body of knowledge.

But tell me: Is wiping down the counters after your experiment part of running an experiment? Does arguing over beers about whose study organism can jump the highest count as a scientific debate? Can writing a blog post about your research count as writing a paper?

I think times are a-changing enough that many scientists, especially early-career scientists, would feel comfortable with including some instances of lab “house-keeping”, socializing (ie, networking), and social media-ing as part of doing science. Here’s a more radical proposition: taking care of yourself is also part of doing science.

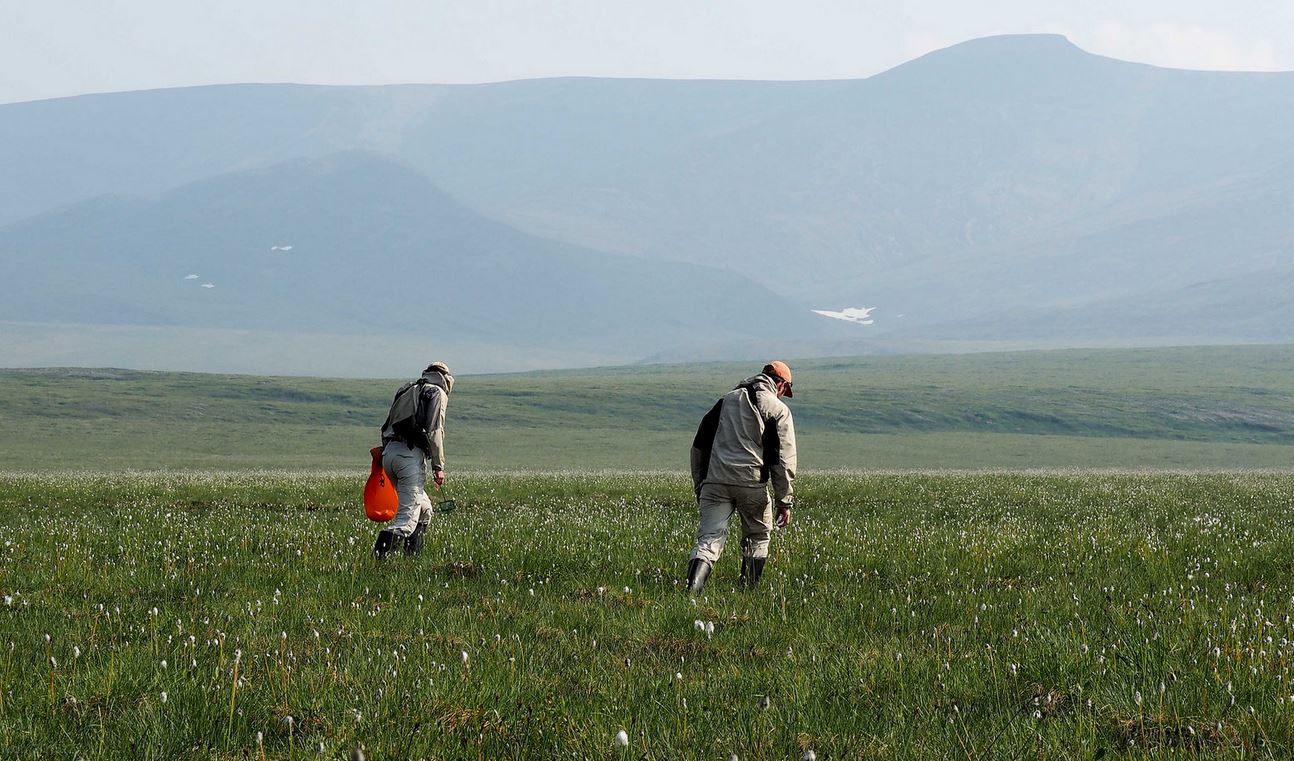
Here’s a strange-but-true thought: If you’re a scientist, your body is a piece of scientific equipment. Your mind is an even more important piece of scientific equipment. If maintaining scientific equipment is a part of doing science, then equally so is maintaining your mind and body. This fuzzy line between doing science and not-doing science is especially evident in field work. In the field, ensuring that your traps don’t get holes and the soles of your feet don’t get holes are equally important parts of the scientific process.

We wear gloves when working with hazardous chemicals, and we consider this part of our scientific protocol. I brush my teeth before engaging in scientific debate so I don’t repel anyone with my breath, and this is part of my scientific protocol. We read papers and sketch down ideas to encourage our minds to come up with interesting hypotheses, and we consider this part of the scientific process. I play with children and read science fiction to encourage my mind to come up with interesting hypotheses, and this is part of my scientific process.

Advertisement

Pyramids of species richness

This post is written by PhD student Shaun Turney, and highlights a recent publication from the lab.

Two years ago, I was finishing my MSc and considering whether I’d like to do a PhD, and if so, with whom. I met with Chris and we threw around a few ideas for PhD projects. It was when he brought up a certain mystery that my decision to do a PhD in his lab was cemented. The mystery? Chris and his former PhD student Crystal Ernst were puzzled why there seem to be so many carnivores on the Arctic tundra, and relatively few herbivores to feed them.

How could it be possible? Is there a high level of cannibalism? (But then it would be like pulling oneself up by ones bootstraps — how does the energy and biomass enter the carnivore population in the first place?) Are the carnivores really omnivores? Is our methodology for sampling the tundra biota biased towards carnivores? Is the transfer of energy from herbivores to carnivores somehow more efficient (less energy loss) than in other ecosystems? These sorts of questions touch on some fundamental questions in ecology and I was hooked.

Shaun Turney, vacuuming the Tundra.

Shaun Turney, vacuuming the Tundra.

It seemed to me the logical first step would be to find out what is a typical predator-prey ratio. In what proportions are the organisms in an ecosystem divided up from plant (lowest trophic level) to top predator (highest trophic level)? The answer to that questions has already been very much explored when it comes to biomass and abundance. Charles Elton explained about 80 years ago that typically the mass and number of organisms form “pyramids”: They decrease with trophic level because energy is lost with each transfer from resource to consumer. But what about diversity? How does the number of species change with trophic level?

I decided to look at the food webs in the data base GlobalWeb to answer this question, and we just published a paper in Oikos on this topic. I found that typically ecosystems form “pyramids of species richness”, just like the pyramid of numbers and pyramid of biomass described by Elton. But some types of ecosystems, notably in terrestrial ecosystems, we can consistently observe a uniform distribution or even an “upside-down pyramid” rather than a pyramid like Elton described. That is, there are consistently cases where there more carnivore species than herbivore species in an ecosystem.

An example of aquatic compared to terrestrial food-web structure (from Turney and Buddle)

An example of aquatic compared to terrestrial food-web structure (from Turney and Buddle)

So evidently, at least when it comes to diversity, the pattern that Chris has observed in the tundra is not so unusual! The next step for me is to try to figure out why. Stay tuned!

Reference:

Turney S and CM Buddle. Pyramids of species richness: the determinants and distribution of species diversity across trophic levels. Oikos. DOI: 10.1111/oik.03404


Yukon field work: Arachnids, landscapes, and the inspiring North

It’s a dream for an arthropod ecologist: a dramatic biome transition from boreal forest to subarctic tundra, a beringian landscape, and diverse and abundant insects and spiders. I have just returned from field work along the Yukon’s Dempster Highway, Canada’s only road to cross the Arctic circle. And again, I was not disappointed!

A stretch of the Dempster Highway

A stretch of the Dempster Highway

This year’s expedition was focused on three projects:

1) Tiny, wonderful arachnids:

On this trip, I continued to document the distribution of an arctic Pseudoscorpion, Wyochernes asiaticus. This is a beringian arachnid, known from the old world, and known in North America from almost exclusively unglaciated parts of the Yukon and Alaska. Like wooly mammoths and giant short-faced bears, these tiny arachnids roamed North America while the rest of the top half of the continent was buried under ice. But unlike the mammoths and giant short-faced bears, the Arctic Pseudoscorpion is not extinct! It’s a relict of the past, thriving today under rocks near beringian rivers and streams. I have been working on this species for many years (and a life history paper about this arachnid will appear in the Canadian Field-Naturalist sometime this month), and each time I visit the Yukon, I leave with more questions, and more specimens. This time, I collected some animals to hopefully work on their population genetics: I am curious about the relatedness among the populations from different watersheds along the Dempster Highway (by the way, I am seeking collaborators [phylogeographers!] for this work… If interested, let me know!)

The Arctic pseudoscorpion, Wyochernes asiaticus

The Arctic pseudoscorpion, Wyochernes asiaticus

2) Northern food webs:

I have left my PhD student Shaun Turney up in the Yukon (along with his field assistant) where he is working on characterizing the arthropod-based food webs along the latitudinal gradient of the Dempster Highway. Past research has given some hints that northern food webs may be atypical, but to fully test this we decided to characterize the entire fauna from 1 x 1 m patches of the tundra. This involved placing tents over the tundra, and Shaun collected critters within those tents, and even “vacuumed” the tundra within the square metre. Shaun started this work near the stunning Richardson mountains above the arctic circle, and over the month of July, will repeat the sampling at different locations along the Dempster Highway.

Shaun Turney, vacuuming the Tundra.

Shaun Turney, vacuuming the Tundra.

3) Thermal biology of wolf spiders

Colleagues from Western University joined me in the Yukon to start some projects related to the thermal biology of the extremely abundant Pardosa wolf spiders which inhabit the tundra. There are several species that occur along the Dempster Highway, and when the weather is good, it’s quite possible to collect hundreds of individuals over the span of several hours. Past work has suggested the density of these spiders is about 0.5 per square metre, and those past estimates certainly seemed accurate on this trip also! The spiders will be taken back to their lab, and I am eager to find out how northern Pardosa may be adapted to Yukon conditions.

Searching for wolf spiders on the Tundra

Searching for wolf spiders on the Tundra

All the sciency parts of our field work were exciting and gratifying, but there are other reasons why the Yukon is special*: it is a breathtakingly beautiful place. From stubby black spruce trees to tufts of tundra-dwelling cotton grass, every turn of the highway or footstep over a hummock is a treat. It’s not all easy (hordes of mosquitoes at some of the campgrounds, or being driven off the tundra by cold rains and strong winds), but it is all inspiring.

The lines between science and passion are blurred on the tundra, and that is a good thing. Searching for spiders is work that is fun; seeing a northern shrike or watching two lonely caribou dart up a river valley is fun that comes with the field work. I am immensely grateful for being able to hike under midnight sun, and be a northern researcher during the day. I am delighted to be able to discover some of hidden secrets of the Yukon.

The northern landscape, near the Yukon-Northwest Territory border.

The northern landscape, near the Yukon-Northwest Territory border.

For more photos of the recent trip, check out my Flickr page.

——

* my colleague Terry Wheeler shares a passion for the Yukon – here is his post which outlines why he keeps returning to the region.

Meet Shaun Turney and Fuzzy Cognitive Mapping

This is another in the series of “Meet the arthropod ecology lab“: Meet PhD student Shaun Turney, and a neat project he’s been working on…

I joined the lab in September and I’ve been really enjoying my first months as a PhD student. I haven’t done any field work yet so that means no specimens to ID or field data to crunch. Instead I’ve been occupying my time very happily playing on the computer. I recently released an R package on CRAN for Fuzzy Cognitive Mapping called “FCMapper”, in collaboration with Michael Bachhofer. It is based on FCMapper for Excel, distributed at http://www.fcmappers.net/joomla/, developed by Michael Bachhofer and Martin Wildenberg. Fuzzy Cognitive Mapping is really cool and you should try it out!

Shaun, in the lab, thinking about food-webs.

Shaun, in the lab, thinking about food-webs.

Recently I’ve become interested in graph theory and all that it has to offer to ecology. Anything that can be represented as boxes and arrows (or lines) can be represented as a graph (in the graph theory sense) and can be analyzed using graph theory tools. I LOVE box and arrow diagrams. Like, maybe an inappropriate amount. Any paper that I’ve printed out and read has at least two or three box and arrow diagrams scribbled into the margins. My notebook is filled with box and arrow diagrams from lectures that I’ve attended or random thoughts that have passed through my mind while I’m sitting on the train. Some people think in words, some in pictures, but I think in boxes and arrows. So you can imagine my enthusiasm as I’ve discovered over the past year that there exists a whole body of mathematics that can represent and analyze box and arrow diagrams.

My latest favourite graph theory tool is called Fuzzy Cognitive Mapping. It can be understood by breaking down the term into its component words. A “cognitive map” in this case is when you represent a system as interconnected concepts. Boxes and arrows, in other words. The “fuzzy” part refers to fuzzy logic. Fuzzy logic is logic that deals with approximate rather than exact values. So to make a fuzzy cognitive map, you make a box and arrow diagram and assign approximate values to the arrows (positive vs negative, weak vs strong relationship). The concepts are then allowed to affect each other until they come to an equilibrium. The exciting part is that then you can try out scenarios! For instance, you could fix one (or more!) concept to be a high or low value and see how it affects the rest of the system. In the context of ecology, one use is to explore potential ecosystem management scenarios (ex, http://en.vedur.is/media/loftslag/Kok_JGEC658_2009.pdf).

If Fuzzy Cognitive Mapping sounds interesting to you (and it should!), you can download the package from CRAN. Michael Bachhofer and I plan to create a tutorial in the spring, but until then you are welcome to email me if you can’t figure out how to use the package.

Download here: http://cran.r-project.org/web/packages/FCMapper/

A graphics output for a toy example I was playing with the other day. It is a cognitive map of things which might affect spotted owl abundance. FCMapper uses igraph for visualization. The thickness of the arrows represents the strength of the relationship and the color represents the direction (red=negative, black=positive), as assigned by me. The size of the circles represents the "size" of each concept at equilibrium, as determined using the nochanges.scenario function in FCMapper. Think of the fun maps you could make for your favourite study system!

A graphics output for a toy example I was playing with the other day. It is a cognitive map of things which might affect spotted owl abundance. FCMapper uses igraph for visualization. The thickness of the arrows represents the strength of the relationship and the color represents the direction (red=negative, black=positive), as assigned by me. The size of the circles represents the “size” of each concept at equilibrium, as determined using the nochanges.scenario function in FCMapper. Think of the fun maps you could make for your favourite study system!